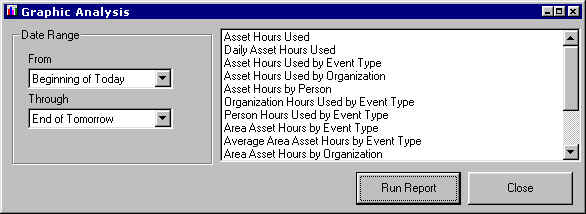
The graphic analysis utility provides Fifteen different analysis forms.
| Graph Title | Questions it is used to answer | How the data is calculated. |
| Asset Hours Used | Which rooms are being used the most and least. | Each reservation's hours within the time period are totaled for its asset. |
| Daily Asset Hours Used | Which rooms are being used the most and least on each day. | Each reservation's hours for each day are totaled for the day and asset. |
| Asset Hours Used by Event Type | What types of events are taking the most and least time for each asset. | Each reservation's hours are totaled for the type of event and asset. |
| Asset Hours Used by Organization | Which organizations are using each room the most and least | Each reservation's hours are totaled for the organization and asset |
| Asset Hours Used by Person | Which persons are using each room the most and least. | Each reservation's hours are totaled for the contact person and asset |
| Organization Hours Used by Event Type | Which Organizations are using space the most and least and what types of events are they using it for. | Each reservation's hours for the period are totaled for the organization and event type. |
| Person Hours Used by Event Type | What sort of Events is each person using and how many hours are they using them. | Each reservation's hours for the period are totaled for the person and event type. |
| Area Asset Hours by Event Type | What is the total of which kind of activity is occurring in each area (floor, region, building, etc) | Each reservation's hours for the period are credited to the event type and to any area that the asset is associated with |
| Average Asset Hours by Event Type | What is the average amount of time the rooms in a particular area (floor, region, etc) are used for particular types of activities | Each reservation's hours for the period are credited to the event type and to any area that the asset is associated with. The result is then divided by the total number of assets associated with the particular area. |
| Area Asset Hours by Organization | What is the total that each organization is using in each area (floor, region, building, etc) | Each reservation's hours for the period are credited to the organization and to any area that the asset is associated with |
| Average Area Asset Hours by Organization | What is the average time the rooms in a particular area (floor, region, etc) are used for each Organization. | Each reservation's hours for the period are credited to the organization and to any area that the asset is associated with. The result is then divided by the total number of assets associated with the particular area. |
| Daily Area Available by Event Type | (Mostly Used by Time and Place Extended) For one particular area how many rooms associated with that area and each event type are completely available for each day. | A stored query is run for each combination of area, event type and date. Note that each day is a separate query. Thus while the report might show some rooms available on each day there may not be any one room available for the whole period |
| Daily Percent Area Available by Event Type | (Mostly Used by Time and Place Extended) For one particular area what percent of the rooms associated with that area and each event type are completely available for each day. | A stored query is run for each combination of the area, event type and date. This is then compared to the same area and event type on a reference date.Note that each day is a separate query. Thus while the report might show some rooms available on each day there may not be any one room available for the whole period |
| Organization Perm/Non-Perm usage by Space Type. | (Mostly used by
Time and Place Extended. All reservations in Time
and Place are non-permanent) How much space is used by each organization and each event type separated by permanently and non-permanently reserved space |
Each reservation's hours for the period are totaled for the organization and event type with each organization's permanent and non-permanent usage treated as if it were two different organizations. |
| Organization Perm/Non-Perm percent usage by Space Type. | (Mostly used by
Time and Place Extended. All reservations in Time
and Place are non-permanent) What percent of the people in each organization have spaces reserved on a particular day, separated by permanently and non-permanently reserved space. This will also yield the in-use 'hoteling ratio' (i.e. 25% occupancy is 4:1 ratio. Remember in such analysis to deduct the percent of permanent reservations. For example if this group has 50% of their persons permanently reserved the 25% is half of the persons not having permanent reservations or a 2:1 ratio) |
Each reservation's hours for the period are totaled for the organization and event type with each organization's permanent and non-permanent usage treated as if it were two different organizations. This is then compared to the total number of persons who are associated with the department and that space type. |
Easily select the items to be included in the analysis
Present the data in either spreadsheet or any number of 2D and 3D graphs. Copy to the clipboard or print.
System Requirements
![]()
The graphic analysis facility requires the 32 bit version of Time and Place. No additional system requirements over those for the 32 bit version of Time and Place.
Pricing and Ordering
![]()
The price of the Graphic Analysis Utility is $39 (US)
The Calendar Publishing Utility is available through the special orders departments of most resellers or directly from Facility Innovations using Visa, MasterCard, or corporate purchase orders. (see Time and Place Pricing and Ordering)
Evaluation Copies
![]()
See Obtaining a Free Trial of Time and Place for information. Simply include in your request that you wish to evaluate the Graphic Analysis Utility as well.
Existing customers who wish to evaluate whether to add Graphic Analysis can call or e-mail us to get a 30 day version of your license file with the Calendar Publishing Utility added. Remember to save your existing License File. You will need it after the 30 day trial is completed if you do not decide to purchase.
![]()